Sales Insights using PowerBi
Building Dashboard using My-SQL and Microsoft PowerBi
July 10, 2024
1. Introduction
Project Overview This project involves creating a Power BI dashboard using data from a MySQL database. The dashboard provides insights into revenue, sales quantity by markets, revenue trends, top customers, and top products.
Although this is a fundamental project that involves fetching data from a SQL server, it has been an invaluable learning experience for me as a beginner in data analysis. Through this project, I gained a deeper understanding of advanced SQL queries and learned how to create an interactive and beautiful Power BI dashboard.😃
2. Dashboard Overiew
A visual example of the Powerbi Dashboard(Unfortunately, sharing the link requires a Microsoft Paid Subscription.)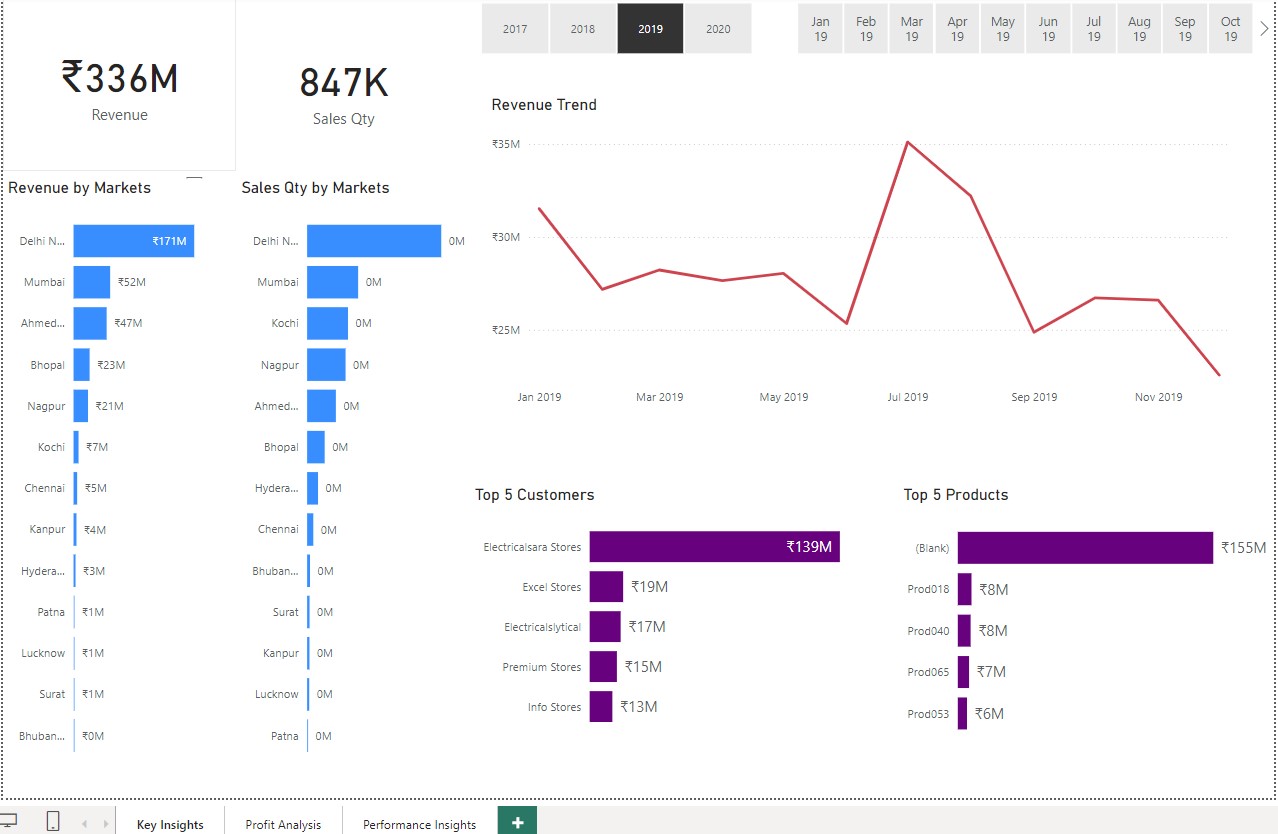
Revenue by Markets: A bar chart displaying revenue generated in different markets. Sales Quantity by Markets: A bar chart showing the sales quantity in various markets. Revenue Trend: A Line chart depicting the revenue trend over time. Top 5 Customers: listing the top 5 customers by revenue. Top 5 Products: showing the top 5 products by revenue.
This dashboard provides a comprehensive view of the business performance, allowing stakeholders to make informed decisions based on the visualized data.
3. Steps
1. Import SQL File into MySQL Database
Import the provided SQL file into the MySQL database to initialize the data.
2 .Run Data Normalization Queries
--Query to Run Through Sales Data
SELECT
    SUM(sales.transactions.sales_amount)
FROM
    sales.transactions
        INNER JOIN
    sales.date ON sales.transactions.order_date = sales.date.date
WHERE
    sales.date.year = 2020
        AND sales.transactions.market_code = 'Mark001';
--Query to check the currency present ins USD
SELECT * FROM  sales.transactions
WHERE sales_amount <= 0;


SELECT COUNT(*) FROM transactions
WHERE transactions.currency = 'INR';

SELECT COUNT(*) FROM  transactions
WHERE  transactions.currency = 'INR';

SELECT * FROM  transactions WHERE
transactions.currency = 'USD' OR transactions.currency = '/USD';
Execute the queries included in the repository to normalize and prepare the data for analysis. These queries ensure the data is clean and ready for use in Power BI.
3. Connect MySQL Database to Power BI
Establish a connection between the MySQL database and Power BI. This allows Power BI to access and visualize the data directly. This Step is very important requires simple steps to connect to locally running SQL server.
4. Create Visualizations in Power BI
Utilize Power BI tools to create various visualizations, such as bar charts, line charts, and tables, to represent the data insights effectively.
Run additional queries to verify the accuracy of the visualizations in Power BI, ensuring that the results match the expected outcomes.
Additional Query must be executed to verify Power-Bi figures which i have update on the github repo